
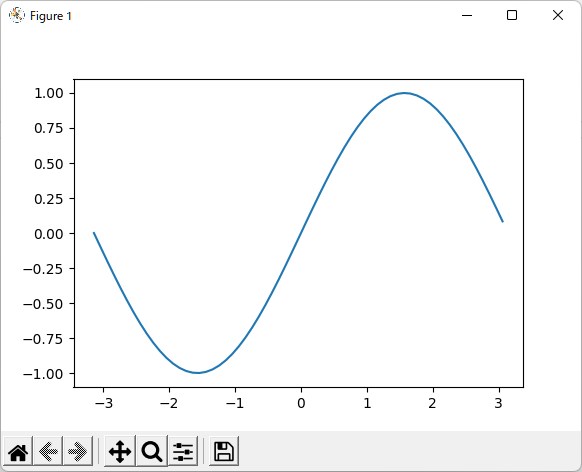
matplotlibで普通に1つのグラフを表示する場合は以下のようにします。
import numpy as np
import matplotlib.pyplot as plt

# 表示するデータの作成
x = np.arange(-np.pi, np.pi, 0.1)
y = np.sin(x)

# グラフの描画
fig = plt.figure() # 省略可
plt.plot(x, y)
plt.show()
(実行結果)
plt.figure()の部分は省略可能ですが、グラフのサイズなどのオプション設定が可能です。
(参考)

matplotlib.pyplot.figure — Matplotlib 3.9.2 documentation
matplotlib.org
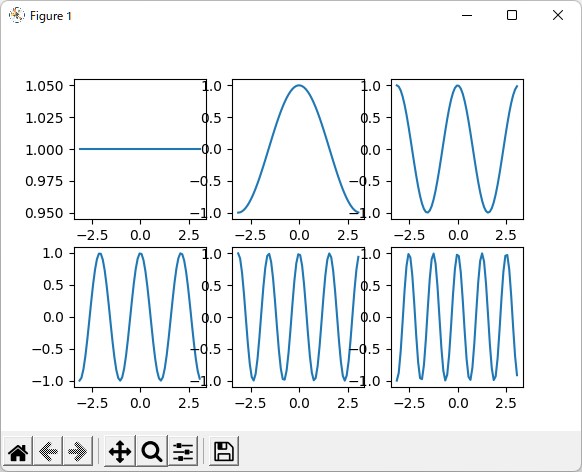
このグラフに複数のグラフを同時に表示する場合は add_subplot()関数を使って以下のようにします。
import numpy as np
import matplotlib.pyplot as plt

# 表示するデータの作成
x = np.arange(-np.pi, np.pi, 0.1)

y0 = np.cos(x * 0)
y1 = np.cos(x * 1)
y2 = np.cos(x * 2)
y3 = np.cos(x * 3)
y4 = np.cos(x * 4)
y5 = np.cos(x * 5)

# グラフ領域の作成
fig = plt.figure(figsize = [5.8, 4])

# 座標軸の作成
ax1 = fig.add_subplot(2, 3, 1)
ax2 = fig.add_subplot(2, 3, 2)
ax3 = fig.add_subplot(2, 3, 3)
ax4 = fig.add_subplot(2, 3, 4)
ax5 = fig.add_subplot(2, 3, 5)
ax6 = fig.add_subplot(2, 3, 6)

# データのプロット
ax1.plot(x, y0)
ax2.plot(x, y1)
ax3.plot(x, y2)
ax4.plot(x, y3)
ax5.plot(x, y4)
ax6.plot(x, y5)

# グラフの表示
plt.show()
(実行結果)
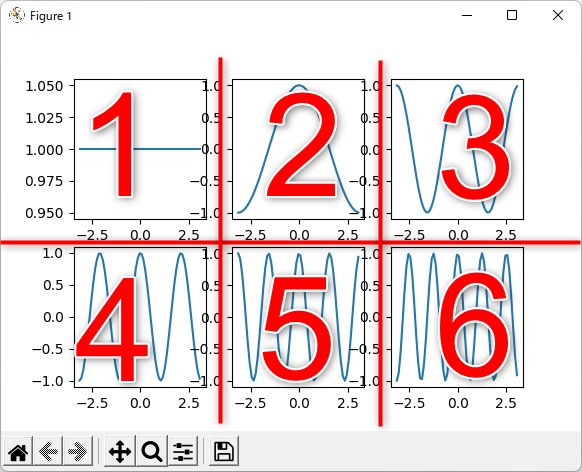
add_subplotの書式は以下の通りです。
add_subplot(何行, 何列, 何番目)add_subplotではグラフ領域を何行何列で分割するか?を指定し、グラフの表示位置を何番目の位置に表示するか?を指定します。
何番目か?は、下図のように左上からの順番を1始まりの番号で指定します。
(参考)

matplotlib.figure — Matplotlib 3.9.2 documentation
matplotlib.org
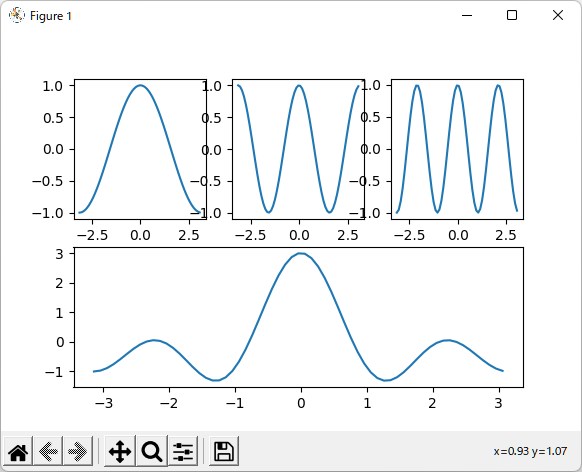
複数グラフを表示する時の行数、列数は、すべて同じにする必要は無く、混在させる事も可能です。
import numpy as np
import matplotlib.pyplot as plt

# 表示するデータの作成
x = np.arange(-np.pi, np.pi, 0.1)

y1 = np.cos(x * 1)
y2 = np.cos(x * 2)
y3 = np.cos(x * 3)

# グラフ領域の作成
fig = plt.figure(figsize = [5.8, 4])

# 座標軸の作成
ax1 = fig.add_subplot(2, 3, 1) # 2行3列の1番目
ax2 = fig.add_subplot(2, 3, 2) # 2行3列の2番目
ax3 = fig.add_subplot(2, 3, 3) # 2行3列の3番目
ax4 = fig.add_subplot(2, 1, 2) # 2行1列の2番目

# データのプロット
ax1.plot(x, y1)
ax2.plot(x, y2)
ax3.plot(x, y3)
ax4.plot(x, y1+y2+y3)

# グラフの表示
plt.show()
(実行結果)

コメント