
エクセルでフーリエ変換をするには、Webで検索するとほとんどの場合、分析ツールのフーリエ解析で行う方法が紹介されているかと思います。
この方法は以下のページを参照ください。
しかしながら、分析ツールで行うフーリエ解析では、解析対象のデータを変更しても、自動で結果を再計算しれくれない上に、Excelのフーリエ解析はFFTであるため、データ個数が2のn乗個(2,4,8,16,32,64,128・・・)という制限があります。
そのため、エクセルのセルの関数のみを使い、フーリエ変換(離散フーリエ変換[DFT])を行う方法を紹介します。
ただし、結論からすると処理が重いため、データ個数が多い場合はExcelのフーリエ解析(FFT)を使った方が良さそうです。
ここでは、フーリエ変換のお勉強用に使って頂ければ幸いです。
エクセルでフーリエ変換を行ったファイルはこちら↓
discrete_fourier_transform_rev1.zip
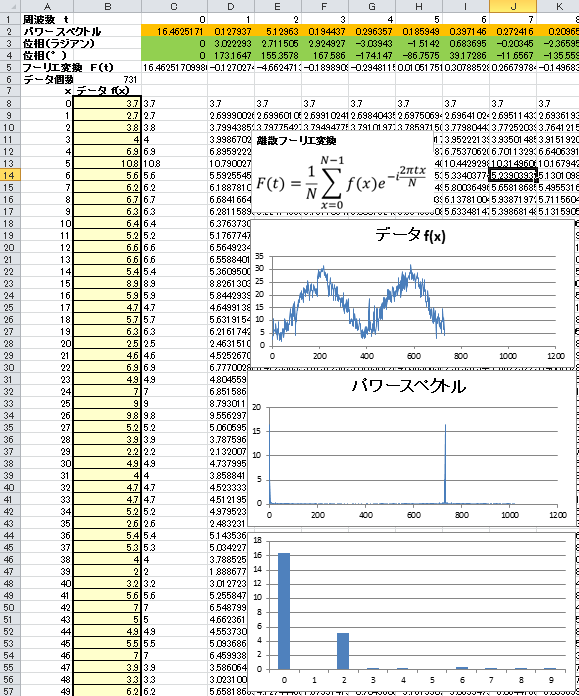
エクセルのイメージはこちら↓
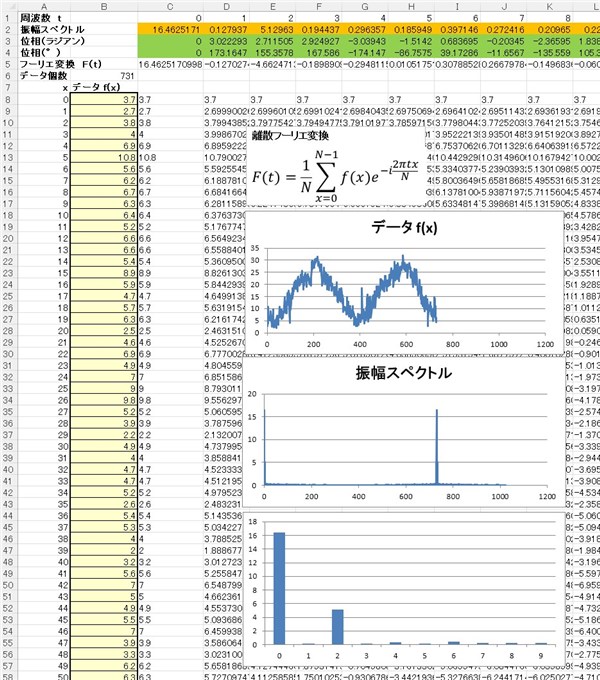
データf(x)と書かれた下の黄色いセルの部分にデータを入力すると、フーリエ変換され、振幅スペクトルと位相が計算されます。
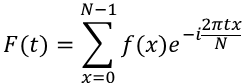
エクセルの分析ツールで行うフーリエ解析では以下の式を用いていますが、
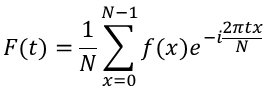
ここでは、フーリエ変換の結果の値に意味合いを持つ下記の式を用いています。
離散フーリエ変換についてはこちらのページでも紹介していますが、エクセルでフーリエ変換を行うために必要な情報をまとめておきます。
まず、フーリエ変換を行うと、各周波数ごとに複素数の成分として変換されます。
複素数zは実数成分をa、虚数成分をb、実数Aとすると
z = a + bi = Aeiθ
のように表示され、図示すると下図のようになります。
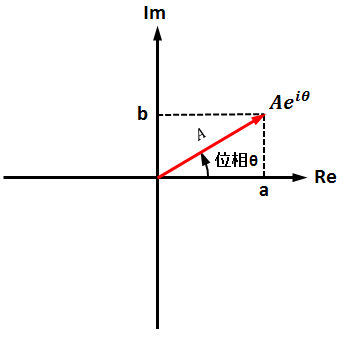
a = A x Cos θ
b = A x Sin θ
複素数の絶対値は
![]()
位相(複素数では偏角といいますが)は
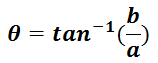
となります。
このへんの感覚は、ベクトルの成分が(a, b)、ベクトルの長さがA、傾きがθの場合と同じなので、覚えやすいかと思います。
エクセルで用いる複素数の関数
エクセルで複素数の計算に用いる関数は関数名の先頭にIMが付く関数を用いますが、今回用いた関数を紹介します。
■複素数 COMPLEX関数
実部をa、虚部をbとする複素数は COMPLEX(a, b)
■複素数の絶対値 IMABS関数
複素数(a + bi)の絶対値 IMABS(“a + bi”)
結果は√(a2 + b2) となります。
■複素数の実部の取得 IMREAL関数
複素数(a + bi)の実部は IMREAL(“a + bi”) = a
■複素数の虚部の取得 IMAGINARY関数
複素数(a + bi)の虚部は IMAGINARY(“a + bi”) = b
■複素数の偏角の取得 IMARGUMENT関数
複素数(a + bi)の偏角は IMARGUMENT(“a + bi”) で-π~πの範囲でラジアン単位で取得
■複素数のべき乗 IMEXP関数
zが複素数のべき乗は IMEXP(z)
(例)ei π/3 を計算するには
IMEXP(COMPLEX(0, PI() / 3))
= 0.866 + 0.5i
となります。
■複素数の足し算(合計を含む) IMSUM関数
複素数xと複素数yの足し算(片方が実数の場合も含む)は IMSUM(x, y)
(例)
セルA1の複素数とセルA2の足し算は IMSUM(A1, A2)
実数の合計の関数(SUM関数)と同様にセルA1~A10を合計するには IMSUM(A1:A10)となります。
■複素数の掛け算 IMPRODUCT関数
複素数xと複素数yの掛け算(片方が実数の場合も含む)は IMPRODUCT(x, y)
■複素数の割り算 IMDIV関数
複素数xと複素数yの掛け算(片方が実数の場合も含む)は IMDIV(x, y)
フーリエ変換の意味合いを読み解く
今回、フーリエ変換の式に
の式を用いたのには、フーリエ変換後の値に意味合いを持つため、あえてこの式を用いました。
今回、用いたデータはこちらのページ(http://www.data.jma.go.jp/gmd/risk/obsdl/)より2015年と2016年の東京の2年分(731日分)のデータを用いました。
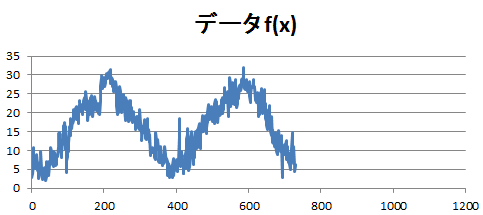
2年分の気温データのため、731個のデータの周波数は2になることを期待しています。
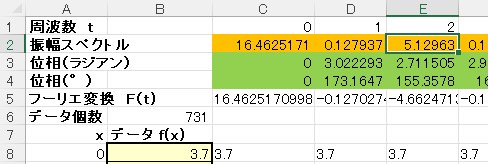
そこで、あらためてエクセルのシートを眺めてみると、振幅ペクトルは周波数tが0の時の次に最大になるのはt=2の時で周波数2の成分が大きい事がわかります。
このことは、731 / 2 = 365.5日 が1周期分のデータ個数となります。
t=0 の時の振幅ペクトルの値(16.4625171)は全体の値の平均値を示しています。
t=2 の時の振幅スペクトルの値(5.12963)の2倍の値(10.25926)が周波数が2の時の振幅を示しています。
※実際にはt=2と複素共役と呼ばれる虚数成分がt=2のときの負になるt=729の時の2つの波形を足し合わせることで、虚数成分が打ち消しあい、実数部分の振幅が2倍となります。
つまり、今回の2年間の気温データは 平均16.4625171 ± 10.25926 ℃ の傾向で気温変化した事がわかります。
t=2 の時の位相(155.3578°)の負の値(-155.3578°)の位置にピークの位置が来ることを意味しています。
ここまでわかると、2年間の気温データの変化の主な成分はCOS波形で表現する事ができ
16.4625171 + 10.25926 × Cos(x / 365.5 × 360° +155.3578°)
となります。
この式を気温データに重ね合わせると↓
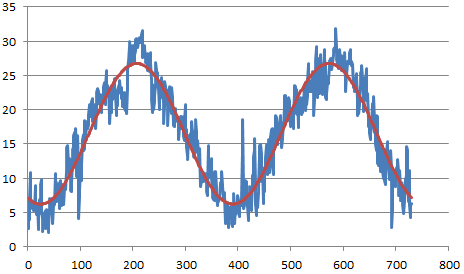
見事、気温変化の傾向がつかめました!!
(追記)
フーリエ変換のマクロ処理版のページも作成しました。
合わせてご参照頂けたら幸いです。
←フーリエ変換へ戻る
コメント
非常に分かりやすい記事でした。
1点質問があるのですが、データ数が異なる波形があった場合にその波形をそれぞれフーリエ変換した後の周波数特性を比較することは可能でしょうか?
記事に記載されているフーリエ変換の式では1/Nがかけられているので、データ個数が異なった波形同士の比較ができるように思ったのですがどうなのでしょうか。
分かりづらい質問で申し訳ありませんがよろしくお願いいたします。
コメントありがとうございます。
データ数の異なる波形の比較という事ですが、データ数が異なると解析している周波数も異なります。
このエクセルのシートの t の値ですが、
t=1 のとき、データ全体で1周期分となる波の成分
t=2 のとき、データ全体で2周期分となる波の成分
t=3 のとき、データ全体で3周期分となる波の成分
:
をフーリエ変換で解析している事になります。
そのため、データの個数がちょうど整数倍になるデータの比較であれば、比較はできると思います。
例えば、データの個数が3倍だとすると、比較するのは、
t=0 と t=0
t=1 と t=3
t=2 と t=6
:
の比較になります。
もし、データの個数が整数倍で無いとしたら、お互い異なる周波数の特性を解析している事になるので、データの多い方を整数倍になるようにカットすれば良いと思います。
データをカットするのは、情報がもったいなく感じるところもあるかと思いますが、そもそもフーリエ変換は、ず~っと周期的にデータが変化しているデータの一部を解析するものなので、データが周期的に変化しているのであれば、データをカットしても大丈夫だと思います。
16.4625171 + 10.25926 × Cos(x / 365.5 × 360° – (-155.3578°))の式についてですが、sinでは再現できないのでしょうか?
調べてもわからず試していないのでわからないのですが、教えて頂けたら大変有難いです。
コメントありがとうございます。
cosをsinで表すには、sinとcosは位相が90°ズレているだけですので、cosの中の角度に90°を足せばsinで表現できますが、フーリエ変換で出てくる位相が0°の状態はcos波形なので、ちょっと気持ち悪い感じがしますかね。
Mr. Akira,
I utilised the VBA Excel sheet from your website to transform a Weekly Data.
As part of personal exercise, I try to construct and combine waves by using the top few components (of N/2) with highest amplitude shown.
However, I’m not sure if I’m doing it correctly overall, especially the calculation of Time Axis (X).
Here’s the spreadsheet link:
https://docs.google.com/spreadsheets/d/1WVl7UER9OXKghfq-QDamnZHoBMmMSf3A9pTzPzDUMOM/edit?usp=sharing
Assuming the time axis is correct, if my sample rate is 7/week, does it mean the formula for cell C16=C15+1/7 ?
The sinusoidal waves of component F27, F22 and F25 look asymmetrical or aperiodic, is it normal? Why so? Or if I have done something wrong?
Thanks in advance for your enlightenment, guidance, and comments.
Why don’t you overlay the raw data (input data) and the generated data?
I have looked at the Excel data, and at least the generated data is cos, not sin.
I did not overlay the data because I want to see each of the frequency separately. But there is one where I combine all frequencies but not overlaying.
What do you mean the generated data is cos, not sin? Did I do something wrong? Please tell me if I do something wrong.
I would recommend that you display them in an overlay first.
By doing so, you will be able to notice what you are getting wrong.
I did an overlay and by looking at where the peaks and troughs congregate comparatively to chart generated by F(Ttl), I gain suspicion of I do something wrong at the F(Ttl) but I can’t be sure.
Frankly speaking, I do not know what I did wrong yet and I can’t seem find the right vocabulary to start asking the right question.
Would you be kind enough to enlighten me how should I look and examine at this so I can get better idea what I did wrong?
Unless the peaks and the troughs are aligned, something is wrong.
As I said last time, you have at least sin and cos wrong.
For example, you are doing it this way.
=$B$7*SIN(2*PI()*$D$7*C15+$C$7)
But sin here is cos.
There may be other places where it’s different, but I’m not sure either.
So please try again, and if not, please share the Excel file showing the raw and generated data overlaid.
I’m so sorry I still don’t quite get what I did wrong at cos and sin there.
I’m willing to share you the excel sheet but let me know how to reach out to you. If it’s not convenient for you to reveal your email address, let me know if you have access to my email address since I have been keying in mine to post comment. Thanks!
I guess my English (DeepL’s English) is not getting through.
Please replace all sin with cos.
In this way
=$B$7*SIN(2*PI()*$D$7*C15+$C$7)
->
=$B$7*cos(2*PI()*$D$7*C15+$C$7)
You can use Google Docs to share files as before, right?
If you have any comments, please write them in this comments section here.
I’ve edited the G.Sheet from Sin to Cos, and making it editable:
https://docs.google.com/spreadsheets/d/1WVl7UER9OXKghfq-QDamnZHoBMmMSf3A9pTzPzDUMOM/edit?usp=sharing
Still, I don’t understand why is it Cos and not Sin.
–
Below is the data FFT-ed through your excel file:
https://we.tl/t-r86hnxTG7x
–
Hope to hear your feedback.
I have created an Excel file with the raw data and the calculated data overlaid, so please check it.
https://imagingsolution.net/wordpress/wp-content/uploads/2021/05/FFT_Practice_2.zip
However, there is not much overlap in the graphs due to the weak frequency trend in the data you gave me.
It is difficult to understand why I did this, including the meaning of Sin and Cos, unless you understand the Discrete Fourier Transform.
For more information about the Discrete Fourier Transform, please refer to the related page here.
https://imagingsolution.net/math/fourier-transform/
It took me a great deal of time to understand the Discrete Fourier Transform.
Akira,
Oh…let me try to rephrase…
For example I have a time-series-data as below
1 Feb : 2.3
2 Feb : -1.2
3 Feb : 3.6
…etc.
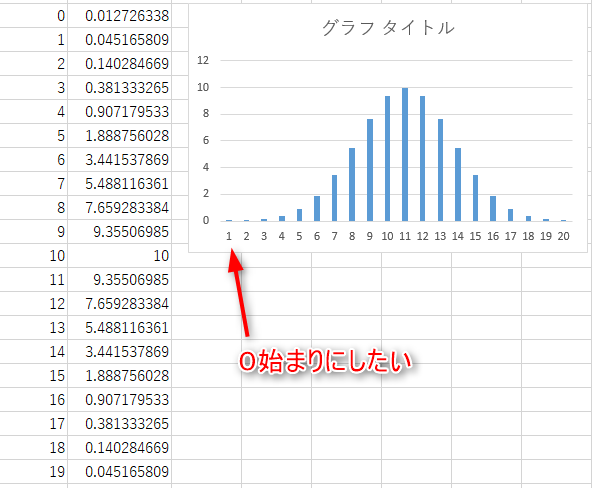
When I open the FFT excel template you shared, why is it that I put my first data (2.3) on bin 0 and not leaving data on bin 0 as 0 and start my first data (2.3) on bin 1 instead?
I hope putting this way is clear enough to express my question. Apologies for inconveniences caused.
I’m sorry.
I can’t understand.
Why do you think the value of Bin0 is 0?
Normally, the index number of input data starts at 0.
This index number is used as the frequency value in the calculation.
0 Feb : 2.3
1 Feb : -1.2
2 Feb : 3.6
…etc.
(See here)
https://en.wikipedia.org/wiki/Discrete_Fourier_transform
I’ve finally understand!
It’s my lack of pre-requisite knowledge on this that causes me confusion.
Again, thank you very much for your generous sharing, kind accommodation, and guidance.
I’m very glad to hear that!
Hi, I have questions about interpreting frequencies or frequency axis:
For example I have 1024 daily data (N), at sample rate (Fs) of 1/day. Below is my understanding so far:
Bin n = n * Fs / N
Bin 1 = 1 * 1 / 1024 = 0.00097656 cycle per day (1024-day-period)
Bin 2 = 2 * 1 / 1024 = 0.00195312 cycle per day (512-day-period)
Bin 3 = 3 * 1 / 1024 = 0.00292969 cycle per day (341.33-day-period)
.
.
.
Bin 512 = 512 * 1 / 1024 = 0.5 cycle per day (2-day-period)
Useful frequencies for 1024 data points can be found from Bin 1-512 due to Nyquist Theorem, correct?
And the highest frequency I can get from this time series data is from Bin 512, frequency of 0.5 cycle per day or 2-day-period cycle. Am I understanding and interpreting all these correctly?
Hope to hear your reply and guidance soon. Thank you.
That’s correct!
[…] 1/16 【Excel】フーリエ変換 […]
Akira,
Thank you for your reply. I have another question:
Since the result came out from Bin 0 will not be useful, why do we put our very first time-series-data starting from Bin 0 and not Bin 1?
It is up to the user to decide if Bin 0 is useful.
Bin 0 means the bias component (average).
And bin 0 is also needed when doing the inverse transform.