Pythonで線や円などの図形を書く方法としては、OpenCVやtkinterなどを用いても出来ますが、今回はPillowを用いて描画する方法です。tkinterの場合はこちらを参照ください。
Pillowで図形を描画するには、描画先のImageオブジェクトからImageDrawオブジェクトを作成し、このImageDrawオブジェクトに対して線などを描画を行います。
ImageDrawオブジェクトに線などを描画すると、書いたデータはImageオブジェクトに反映されます。
簡単なサンプル
from PIL import Image, ImageDraw

# カラーの画像データ(Imageオブジェクト)の作成
img = Image.new("RGB", (300, 100), "White")
# ImageDrawオブジェクトの作成
draw = ImageDraw.Draw(img)

# 直線の描画
draw.line([(10, 90), (290, 10)], fill = "Blue", width = 10)

# 画像の表示
img.show()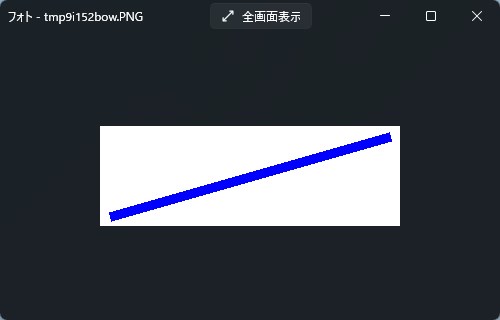
図形の種類
● 直線、折れ線
ImageDraw.line(xy, fill=None, width=0, joint=None)| xy | 始点と終点、もしくは折れ線を構成する交点の座標をタプルのリスト[(x, y), (x, y), (x, y),・・・] もしくは x,y座標のリスト[x, y, x, y, x, y,・・・]で指定します。 |
| fill | 線色を指定します。 |
| width | 線幅を指定します。 |
| joint | 折れ線の場合の、つなぎ目の状態を指定します。
何も指定しない(None)と線の継ぎ目に切れ目ができます。
“curve”を指定すると、丸く繋いでくれます。
|
● 矩形(四角形)
ImageDraw.rectangle(xy, fill=None, outline=None, width=1)| xy | 左上と右下の座標をタプルのリスト[(x0, y0), (x1, y1)] もしくは x,y座標のリスト[x0, y0, x1, y1]で指定します。 |
| fill | 領域を塗りつぶす色を指定します。 |
| outline | 輪郭線の色を指定します。 |
| width | 線幅を指定します。 |
● 角の丸い矩形
ImageDraw.rounded_rectangle(xy, radius=0, fill=None, outline=None, width=1)| xy | 左上と右下の座標をタプルのリスト[(x0, y0), (x1, y1)] もしくは x,y座標のリスト[x0, y0, x1, y1]で指定します。 |
| radius | 角の半径を指定します。 |
| fill | 領域を塗りつぶす色を指定します。 |
| outline | 輪郭線の色を指定します。 |
| width | 線幅を指定します。 |
● 楕円、円
ImageDraw.ellipse(xy, fill=None, outline=None, width=1)| xy | 左上と右下の座標をタプルのリスト[(x0, y0), (x1, y1)] もしくは x,y座標のリスト[x0, y0, x1, y1]で指定します。 |
| fill | 領域を塗りつぶす色を指定します。 |
| outline | 輪郭線の色を指定します。 |
| width | 線幅を指定します。 |
● ポリゴン(折れ線の始点と終点を結んだ図形)
ImageDraw.polygon(xy, fill=None, outline=None)| xy | 折れ線を構成する交点の座標をタプルのリスト[(x, y), (x, y), (x, y),・・・] もしくは x,y座標のリスト[x, y, x, y, x, y,・・・]で指定します。 |
| fill | 閉じた領域を塗りつぶす色を指定します。 |
| outline | 輪郭線の色を指定します。 |
● 正n角形
ImageDraw.regular_polygon(bounding_circle, n_sides, rotation=0, fill=None, outline=None)| bounding_circle | 多角形に外接する円の中心(x, y)および半径r を指定します。 指定方法 (x, y, r) および ((x, y), r) |
| n_sides | 何角形かを指定します。 3以上 |
| rotation | 回転角度を度数で指定します。 |
| fill | 閉じた領域を塗りつぶす色を指定します。 |
| outline | 輪郭線の色を指定します。 |
● 円弧
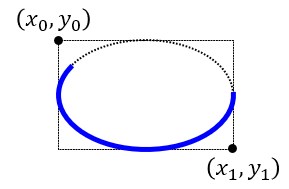
ImageDraw.arc(xy, start, end, fill=None, width=0)| xy | 円弧を構成する楕円を囲む矩形の左上と右下の座標をタプルのリスト[(x0, y0), (x1, y1)] もしくは x,y座標のリスト[x0, y0, x1, y1]で指定します。 |
| start | 円弧の始点の角度(3時方向が0度、時計周りが正)を指定します。 |
| end | 円弧の終点の角度(3時方向が0度、時計周りが正)を指定します。 |
| fill | 線色を指定します。 |
| width | 線幅を指定します。 |
● 円弧(始点と終点が直線で結ばれた状態)
ImageDraw.chord(xy, start, end, fill=None, outline=None, width=1)| xy | 円弧を構成する楕円を囲む矩形の左上と右下の座標をタプルのリスト[(x0, y0), (x1, y1)] もしくは x,y座標のリスト[x0, y0, x1, y1]で指定します。 |
| start | 円弧の始点の角度(3時方向が0度、時計周りが正)を指定します。 |
| end | 円弧の終点の角度(3時方向が0度、時計周りが正)を指定します。 |
| fill | 閉じた領域を塗りつぶす色を指定します。 |
| outline | 輪郭線の色を指定します。 |
| width | 線幅を指定します。 |
● 円弧(始点と終点がそれぞれ原点と直線で結ばれた状態)
ImageDraw.pieslice(xy, start, end, fill=None, outline=None, width=1)| xy | 円弧を構成する楕円を囲む矩形の左上と右下の座標をタプルのリスト[(x0, y0), (x1, y1)] もしくは x,y座標のリスト[x0, y0, x1, y1]で指定します。 |
| start | 円弧の始点の角度(3時方向が0度、時計周りが正)を指定します。 |
| end | 円弧の終点の角度(3時方向が0度、時計周りが正)を指定します。 |
| fill | 閉じた領域を塗りつぶす色を指定します。 |
| outline | 輪郭線の色を指定します。 |
| width | 線幅を指定します。 |
● 点
ImageDraw.point(xy, fill=None)| xy | 点の座標をタプルのリスト[(x, y), (x, y), (x, y),・・・] もしくは x,y座標のリスト[x, y, x, y, x, y,・・・]で指定します。 |
| fill | 点の色を指定します。 |
備考
色の指定は”Red”, ”Green”などの色の名前の文字列を使うか、R,G,Bの順で16進数で指定(#FF0000だと赤)するか、(R,G,B)のタプルで指定します。
(参考)

W3Schools.com
W3Schools offers free online tutorials, references and exercises in all the major languages of the web. Covering popular...
楕円や円弧の座標指定位置は、下図のようになります。
サンプルプログラム
from PIL import Image, ImageDraw
import random # 点のランダム表示用

# カラーの画像データ(Imageオブジェクト)の作成
img = Image.new("RGB", (600, 700), "White")
# ImageDrawオブジェクトの作成
draw = ImageDraw.Draw(img)

# 直線
draw.line([(10, 60), (290, 10)], fill = "Blue", width = 3)

# 折れ線
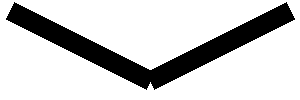
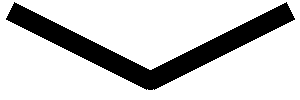
draw.line([(10, 100), (150, 180), (290, 100)], fill = "Green", width = 20)
draw.line([(10, 200), (150, 280), (290, 200)], fill = "Red", width = 20, joint="curve")

# 四角形
draw.rectangle([(10, 300), (290, 380)], fill = "#FF8C00", outline="#DC143C", width = 5)

# 角の丸い四角形
draw.rounded_rectangle([(10, 400), (290, 480)], radius = 15, fill = (0, 0, 255), outline="Red", width = 5)

# 楕円
draw.ellipse([(10, 500), (290, 580)], fill = "Magenta", outline="Cyan", width = 5)
# 円
draw.ellipse([(110, 600), (190, 680)], fill = "Green", outline="Yellow", width = 5)

# ポリゴン(始点と終点を結んだ多角形)
draw.polygon([(310, 0), (450, 30), (590, 0), (590, 80), (450, 50), (310, 80)], fill = "Red", outline="FireBrick")
draw.polygon([(310, 100), (410, 180), (490, 100), (590, 180)], fill = "blue", outline="red")

# 正n角形
draw.regular_polygon((450, 240, 40), 5, 0, fill = "blue", outline="red")

# 円弧
draw.arc([(310, 300), (590, 380)], 0, 240, fill = "Blue", width = 5)

# 円弧(始点と終点を結ぶ)
draw.chord([(310, 400), (590, 480)], 0, 240, fill = "Blue", outline="Red", width = 5)

# 円弧(始点・終点と原点を結ぶ)
draw.pieslice([(310, 500), (590, 580)], 0, 240, fill = "Blue", outline="Red", width = 5)

# 点
for i in range(1000):
    x = random.randrange(310, 590)
    y = random.randrange(600, 680)
    # 点の描画
    draw.point((x,y), fill = "Blue")

# 画像の保存
img.save("image.png")

# 画像の表示
img.show()
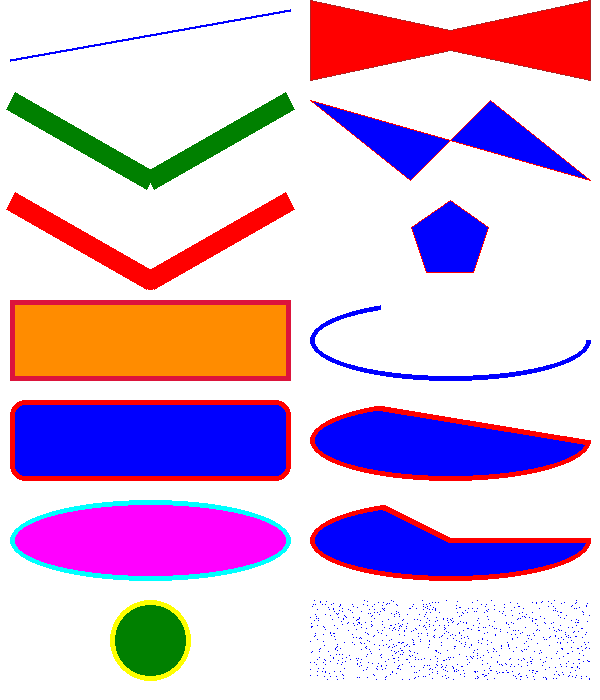
(実行結果)
参照ページ
ImageDraw module
The ImageDraw module provides simple 2D graphics for Image objects. You can use this module to create new images, annota...

W3Schools.com
W3Schools offers free online tutorials, references and exercises in all the major languages of the web. Covering popular...
関連記事

【Python/tkinter】線や円などの図形の描画
前回は、Pillowで線や円などの図形の描画について説明しましたが、今回はtkinterでCanvasウィジェットの上に図形を描画する方法についてです。前半では、線や矩形、楕円などのメソッドについて説明し、後半にこれらメソッドを用いて下図の...



コメント